
.webp?width=350&height=54&name=2026%20Jan%20Adaptive%20Logo%20(350%20X%2054).webp "2026 Jan Adaptive Logo")
Data flow diagrams (DFDs) is a powerful technique that allow business analysts to visualize and analyze the data flow within a system or among multiple systems. Whether you're a seasoned professional or just starting in the field, understanding data flow diagrams (DFDs) is crucial for effective analysis and problem-solving.
In this blog post, we will delve into the world of data flow diagrams, exploring their history, applications, notations, rules, and much more! So grab a cup of coffee, and let's dive right in to unravel the mysteries behind these fascinating diagrams.

What is a data flow diagram?
A data flow diagram (DFD) is a graphical representation of the data flow within a system. It provides a visual tool for understanding how information moves from one process to another, highlighting the inputs, outputs, and processes involved in the system.
At its core, a DFD consists of four main components: processes, data stores, external entities, and data flows. Processes represent activities or functions that transform input data into output data. Data stores are repositories where information is stored for later use. External entities are sources or destinations of data outside the system being analyzed. And finally, data flows depict the movement of information between these various components.
By using symbols and arrows to illustrate these elements and their relationships, DFDs offer a clear and concise way to map out complex systems. They enable business analysts to identify potential bottlenecks or inefficiencies in how data is processed and shared within an organization.
DFDs can be developed at different levels of detail depending on the scope and complexity of the system being analyzed. This allows analysts to zoom in on specific areas for closer examination or zoom out for an overall view of the entire system.
DFDs serve as valuable tools for business analysts by providing insights into how information flows through different parts of a system. They help facilitate communication between stakeholders by providing a common visual language that everyone can understand. So whether you're analyzing existing systems or designing new ones, incorporating DFDs into your toolkit will undoubtedly enhance your analytical capabilities!
History of the data flow diagram
Data flow diagrams (DFDs) have been around for several decades and have played a crucial role in the field of business analysis. The concept of data flow diagrams was first introduced by Larry Constantine, an American software engineer and management consultant, in the 1970s. Initially, DFDs were mainly used in system development to represent how data flows through different processes within a system. However, over time, they gained popularity among business analysts as a powerful tool for understanding and documenting complex business processes.
In the early days, DFDs were hand-drawn on paper or whiteboards. Analysts would meticulously map out each process and its associated data flows using standard symbols and notations. This manual approach was quite labor-intensive and prone to errors. With technological advancements, computer-based tools emerged that made it easier to create and modify DFDs digitally. These tools offered features like automatic layout generation, symbol libraries, and collaboration capabilities, significantly enhancing productivity.
Today, DFDs continue to be widely used by business analysts across various industries. They visually represent how information moves through an organization's systems or processes, helping analysts identify inefficiencies or bottlenecks that can be addressed for better operational efficiency. The evolution of DFDs reflects the growing importance of visual models in analyzing complex systems. As technology continues to advance rapidly, we can expect further enhancements in tools and techniques for creating more sophisticated data flow diagrams that cater to the ever-changing needs of businesses.
Stay tuned for our next blog section, where we will delve into how business analysts can effectively utilize data flow diagrams!

How Can Business Analysts Use the Data Flow Diagram?
As a business analyst, you are responsible for understanding and documenting data flow within an organization. This is where data flow diagrams (DFDs) come into play. DFDs provide a visual representation of how data moves through different processes in a system. By using DFDs, business analysts can effectively communicate complex systems to stakeholders clearly and concisely. These diagrams help identify a system's inputs, outputs, processes, and data storage points, allowing analysts to understand better how information is processed.
Business analysts can also use DFDs to identify potential bottlenecks or inefficiencies in existing systems. They can recommend improvements or modifications that optimize performance and enhance overall productivity by analyzing the data flow. Furthermore, DFDs can serve as valuable documentation during system development or enhancement projects. They provide a blueprint for developers to follow when designing or modifying software systems based on specific requirements captured by business analysts.
In addition to these practical applications, DFDs allow business analysts to collaborate with stakeholders more effectively. By visually representing complex concepts in an easily understandable format, DFDs facilitate discussions and ensure everyone involved has a shared understanding of the system being analyzed. Data flow diagrams are powerful tools that enable business analysts to analyze and communicate information flows within an organization. Their versatility makes them invaluable assets throughout various stages of project lifecycles – from requirement gathering to solution design and implementation planning.
Notations used in data flow diagrams
Notations are crucial to data flow diagrams (DFDs) as they help represent a system's different elements and relationships. These notations make it easier for business analysts to communicate complex processes and information flows effectively.
One commonly used notation in DFDs is the process symbol, represented by a rectangle. This symbol represents activities or tasks that transform input data into output data. Another important notation is the external entity symbol, depicted as a square or rectangle with rounded corners. It represents sources or destinations of data outside the system being analyzed, which can determine the next step.
Data stores are shown using an open-ended rectangle, indicating where data is stored within the system. Data flows are represented by arrows connecting various symbols, showing how information moves between processes, entities, and stores.
Annotations can also be included in DFDs to provide additional details about specific elements or relationships. These annotations help clarify any ambiguities and ensure that all stakeholders have a clear understanding of the diagram.
These notations serve as visual aids for understanding and documenting complex systems efficiently. By utilizing standardized symbols and annotations, business analysts can create comprehensive DFDs that accurately represent information flows within an organization's processes without confusion or misinterpretation.
Data flow diagram rules and tips
Data flow diagrams (DFDs) are valuable tools for visualizing how data flows within or between different systems. There are certain rules and tips to follow to ensure that DFDs accurately represent the information being conveyed.
It is important to remember that each process in a DFD should have at least one input and one output. This ensures that data is being transformed as it moves through the system. Additionally, processes should only produce outputs that are necessary for other processes or external entities.
Another rule to keep in mind is that data stores should not directly connect with each other. Instead, they should be connected through processes or external entities. This helps maintain clarity and prevents confusion when analyzing the flow of information.
When creating DFDs, it can be helpful to use consistent naming conventions for all elements, such as processes and data flows. Clear and concise labels make it easier for stakeholders to understand the diagram without unnecessary complexity.
Furthermore, maintaining balance in the diagram is crucial. A well-balanced DFD has an appropriate level of detail at each level and avoids overwhelming viewers with excessive complexity or too much abstraction.
Regular validation of the DFD against real-world scenarios is essential. Reviewing and testing the diagram's accuracy with actual users or subject matter experts can identify and address any discrepancies or missing elements early on.
By following these rules and tips when creating data flow diagrams, business analysts can effectively communicate complex systems visually clearly while ensuring an accurate representation of the general overview of business analysis process flow and the information flows within an organization's business process documentation and business function processes.
Levels of Data flow diagrams
Data flow diagrams (DFDs) are graphical representations that illustrate the flow of information within a system. They provide a visual representation of how data moves from one process to another and the inputs and outputs at each stage. DFDs can be categorized into four levels: context diagram, level 0 diagram, level 1 diagram, and so on.
The first level is known as the context diagram. It provides an overview of the entire system by showing how it interacts with external entities such as users or other systems. This high-level view helps to understand the scope and boundaries of the system being analyzed.
The next level is the level 0 diagram, also called the main process or top-level DFD. It breaks down the system into its main processes or functions and shows how they interact. This level provides more detail than the context diagram but still keeps it relatively simple.
As we move down further, we reach lower levels, such as level 1 diagrams which provide more detailed breakdowns of specific processes shown in Level 0 DFD. These lower levels continue to break down processes into smaller subprocesses until all necessary details are captured.
Each subsequent level adds more detail and complexity while maintaining clarity in representing data movement within a system. By breaking down complex systems into manageable chunks, business analysts can easily identify areas for improvement or potential bottlenecks in information flow, considering the frequency of occurrence within the processes.
Understanding different levels of data flow diagrams is crucial for business analysts to analyze systems and improve their efficiency effectively. The various levels help to provide a comprehensive view of how data flows through different processes within a system, enabling analysts to identify areas for optimization and enhancement.
Advantages of data flow diagrams for Business Analysts
Data flow diagrams (DFDs) offer several advantages to business analysts in their analysis and documentation efforts. DFDs provide a visual representation of how information flows within an organization or system. This visual format enables better understanding and communication among stakeholders, making identifying bottlenecks, redundancies, or inconsistencies in the data flow easier. DFDs help in identifying data transformations and processes involved in a system. By mapping out the inputs, outputs, and functions performed on the data at each stage of its journey through the system, business analysts can gain insights into potential areas for improvement or optimization.
Furthermore, DFDs promote clarity and consistency when documenting complex systems. They allow analysts to break down complicated processes into manageable components that are easier to comprehend and analyze. This simplification aids not only in understanding current systems but also in designing future enhancements or modifications. Another advantage is that DFDs facilitate collaboration between different stakeholders involved in a project or process. By providing a common language and visual representation of the information flow across departments or teams, DFDs foster effective communication and alignment among all parties.
DFDs enable business analysts to evaluate the impact of proposed changes before implementation. Analysts can assess how alterations might affect other parts of the system by analyzing existing data flows and their relationships with various entities within the organization's ecosystem, potentially avoiding costly mistakes or disruptions.
In conclusion,
The use of data flow diagrams offers numerous benefits for business analysts working on analyzing systems' functionalities and requirements. From enhancing communication to facilitating process improvements – these visuals prove invaluable tools throughout various stages of software development lifecycle projects.
Limitations of Data flow diagrams for Business Analysts
While data flow diagrams (DFDs) are a valuable tool for business analysts, they have some limitations that should be considered. One limitation is that DFDs can become complex and difficult to understand when dealing with large systems or processes. As the level of detail increases, it becomes more challenging to represent all the interactions accurately.
Another limitation is that DFDs only depict the flow of information, not how it is processed or transformed within a system. This means that important details about data manipulation may be overlooked in the diagram, leading to potential gaps in understanding. Additionally, DFDs are static representations and do not capture real-time aspects of a system. They provide a snapshot view of information flows at a given moment but cannot show dynamic changes over time. This lack of dynamic representation can limit their usefulness in scenarios where timing or sequencing is crucial.
Furthermore, DFDs may not always be suitable for highly technical or complex systems that involve intricate calculations or algorithms. These types of processes may require more specialized modeling techniques to represent their functionality accurately. It's important to note that creating accurate DFDs relies on input from stakeholders who may have differing perspectives and interpretations. This subjectivity can introduce bias and inconsistencies in the diagrams if not properly managed.
Despite these limitations, data flow diagrams remain an effective tool for visualizing system information flows and identifying improvement areas. It's essential for business analysts to leverage other modeling techniques alongside DFDs when necessary to overcome these limitations and ensure comprehensive analysis.
Unified Modeling Language vs. data flow diagrams
Unified Modeling Language (UML) and data flow diagrams (DFD) are powerful tools used in software engineering. While they serve similar purposes, there are some key differences between them.
UML is a standardized modeling language that allows developers to represent a system's structure and behavior visually. It offers a wide range of diagram types, such as use case diagrams, class diagrams, and sequence diagrams. UML provides a comprehensive way to capture different aspects of a system's design and helps stakeholders understand the intricacies involved.
On the other hand, DFDs focus specifically on representing the flow of data within a system or process. They illustrate how information moves from one entity to another through processes, data stores, and external entities. DFDs provide clarity on what inputs are required for each process and what outputs they produce.
While UML is more versatile in terms of its diagram types, DFDs excel at capturing data flows in an intuitive manner. Business analysts often find DFDs valuable when analyzing existing systems or designing new ones because they can easily identify inefficiencies or bottlenecks in data movement.
However, it's important to note that UML and DFDs serve different purposes; therefore, choosing between them depends on the specific needs of your project. In some cases, both techniques may be used together to create a holistic view of the system being analyzed or designed.
In summary, UML provides a broader range of modeling options, while DFDs offer focused insights into data flows within systems. Each has its own merits depending on the context in which it is applied.

Steps to develop data flow diagrams
- Identify the system boundaries: The first step in developing a data flow diagram (DFD) is to define the boundaries of the system being analyzed clearly. This helps determine what should be included in the diagram and what should be excluded.
- Identify external entities: Once you have defined the system boundaries, identify any external entities that interact with the system, considering your business objectives. These could be people, other systems, or even physical objects.
- Determine major processes: Next, identify the major processes within the system. These are activities or tasks that transform inputs into outputs, aligning with your overarching business objectives.
- Identify data flows: Now, it's time to determine how information moves through the system. Identify all relevant data flows between processes and external entities.
- Add data stores: Data stores represent where information is stored within the system. Include these in your DFD to accurately depict how data is stored and accessed.
- Define relationships between elements: Connect all elements on your DFD using arrows to show how information flows from one component to another.
- Validate and refine your diagram: Review your DFD for accuracy and consistency, ensuring that it accurately represents how information moves through the system.
Remember, developing a DFD requires careful analysis and understanding of a system's business processes and technical aspects!
Business Analyst Delivery Plan
To create the Business Analyst Delivery Plan, the business analyst needs to outline specific tasks, deadlines, and responsibilities, including a detailed timeline. This plan should encompass the necessary details for software engineering and the technical implementation of requirements for the development team. It involves team discussions, stakeholder involvement, and a significant amount of background information. The plan should align with the business strategy, objectives, and overall development goals. These considerations ensure that the project progresses smoothly and meets the desired outcomes.
Common software used to develop data flow diagrams
When it comes to creating data flow diagrams, several software tools are available that can simplify the process and enhance productivity for business analysts, especially for new employees. These software programs provide a user-friendly interface and powerful features specifically designed for developing data flow diagrams.
One popular software is Microsoft Visio, which offers a wide range of diagramming tools, including templates for creating data flow diagrams. With its intuitive drag-and-drop functionality, users can easily create and modify DFDs to represent complex systems.
Another commonly used tool is Lucidchart, an online platform that allows users to collaborate in real time while developing their DFDs. It provides various shapes and symbols specific to DFDs, making it easy to visualize the flow of information within a system.
Enterprise Architect by Sparx Systems is another robust software solution often utilized by business analysts. It supports data flow diagrams and other modeling techniques such as UML, BPMN, and ERD. This comprehensive tool enables analysts to create highly detailed and interactive DFDs.
A lesser-known yet powerful option is Draw.io (now integrated with Google Drive). It provides a simple interface with all the necessary elements required for constructing accurate DFDs efficiently. Its cloud-based nature allows seamless collaboration among team members.
Regardless of the chosen software, business analysts must select one that aligns with their specific needs and preferences. Each tool has its own unique features and capabilities that cater to different requirements or project complexities, making a SWOT analysis or PESTLE analysis essential in the selection process.
In conclusion,
The availability of various software options makes it easier than ever before for business analysts to develop accurate and effective data flow diagrams. These tools streamline the process while providing flexibility in terms of collaboration and customization options. By leveraging these technologies effectively, business analysts can enhance their ability to analyze complex systems accurately and communicate them visually across stakeholders!
Worked out Example:
Let us learn the data flow diagram by means of an example. Governance, Risk, and Compliance (GRC) management system is developed for the IT and ITES domain. The primary objective of the GRC management system is to help companies implement Governance, Quality, and Information Security Management Systems in an integrated manner. It has various features, including planning and tracking projects and programs using standards such as CMMI, ISO 9001, and ISO 27001, etc.
Through this example, let us try to understand how the data flows and gets transformed in the project schedule management module of Governance, Risk, and Compliance management.
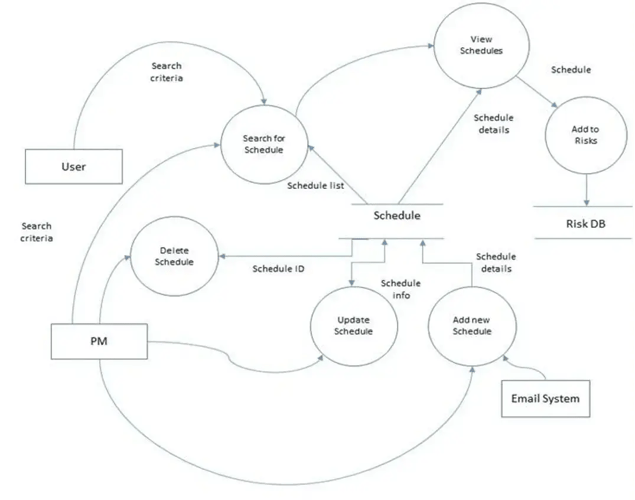
An external entity is a person, organization, automated system, or device capable of producing or receiving data. It can be a source of information (source) or a sink (receiver of information). The user shown in the diagram is a source, as the user has to provide the search criteria. Another source is the PM. These are represented using rectangles.
Search for schedule, delete a schedule, add a new schedule, update a schedule, etc., are data processes. Here, the data is transformed into an output. For instance, the add new schedule process provides schedule details as its output. It is represented in the form of a circle or a rectangle with rounded corners. Processes should have at least one input and one output.
Schedule and Risk DB are data stores. The schedule data store is a collection of data related to schedules where data may be read repeatedly and stored for further use. Each data store must have at least one data flow going to or coming from it. It is represented as two parallel lines or as an open-ended rectangle.
Thus, data flow diagrams portray the transformation of data. It depicts where the data comes from, the activities which process the data, whether the output results are stored or utilized by another activity, etc. DFDs are relatively simple to understand and are a great way to illustrate interfaces, connections to other systems, etc. However, it doesn't illustrate the sequence of activities and can become increasingly complex for large-scale systems.
Key Takeaways and Summary of Data Flow Diagrams
Data flow diagrams (DFDs) are invaluable tools for business analysts in understanding and documenting how data moves within a system. By providing a visual representation of the current processes, inputs, outputs, and data flows involved in a business process or system, process flow diagrams (DFDs) allow analysts to identify inefficiencies, complexities, and potential areas for improvement.
Throughout history, DFDs have evolved from simple flowcharts to comprehensive modeling techniques. Business analysts can leverage these diagrams to communicate complex concepts with stakeholders effectively. The notations used in DFDs provide clarity and consistency in depicting different elements of the system.
While there are some limitations to using DFDs as standalone models due to their high-level nature, they offer several advantages that make them valuable assets for business analysis. These include improved understanding of system functionality by stakeholders, identification of bottlenecks and redundancies in processes, effective documentation for future reference or modifications, and ease of communication between technical and non-technical team members.
It's important to note that Unified Modeling Language (UML) is another widely used modeling technique that offers more detailed representations than traditional DFDs. However, many business analysts still prefer using DFDs due to their simplicity and ease of use.
To develop accurate data flow diagrams:
- Identify the scope and boundaries of the system.
- Determine the entities involved.
- Define the processes taking place within the system.
- Identify inputs and outputs associated with each process.
- Establish data stores where information is stored.
- Draw arrows representing data flows between processes.
Various software tools available today assist business analysts in creating professional-looking DFDs efficiently. Some popular options include Microsoft Visio®, Lucidchart®, Gliffy®, or even diagramming features offered by project management platforms like Jira®.
In conclusion,
Data flow diagrams serve as essential tools for business analysts when it comes to analyzing systems' workflows effectively by providing a clear visual representation of data movement within a system.

Vendor Assessment Demystified: Expert Tips & Strategies

Financial Analysis With Worked out Example

 Contact Us
No Comments Yet
Let us know what you think